
Contents

- Necessity of VQML
- What is VQML?
- Techniques in VQML
- Learning & Evaluation Process of VQML
- Input & Output Value
- Dataset Utilized in VQML
- Outstanding Points of VQML
- High Performance of VQML
- Verify Reliability of VQML
Necessity of VQML
The mobile network market is growing explosively due to the rapid growth of 4G and 5G subscribers and the expansion of service coverage. According to the Ericsson Mobility Report in November 2020, 5G subscribers are expected to exceed 3.5 billion by the end of 2026.
In this situation, the growth of mobile video services is no surprise. Figure 1 shows the traffic volume of mobile data by media measured by BI Intelligence. In 2020, video services account for about 75% of the total mobile data usage. Combined with the growth of 5G and the COVID-19 situation we are facing today, this number will grow even more and mobile network operators should be prepared for it.
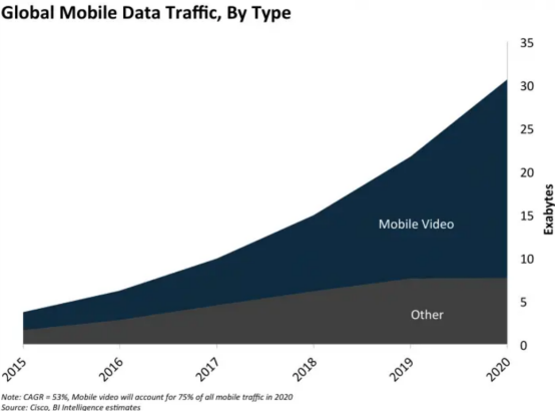
Figure 1. Mobile data traffic usage by media
The performance and quality of the video services that users experience are critical aspects of the network operations. In live-streaming services that transmit video over the network in real-time, videos may not be completely transmitted due to various loss issues in the network. This may result in different qualities of received videos between consumers. To prevent such situation, we need to find a way to accurately measure the video quality in real-time and ensure consistence in good quality of video transmission on mobile networks.
Innowireless’ VQML is introduced as a deep learning-based, high-level video quality assessment solution. Compared to other traditional evaluation methods, VQML is distinguished as a better solution due to its faster processing speed, cheaper implementation and no need for original reference video.
As a new way to measure video quality, VQML lets mobile and broadband network operators meet customer expectations and needs with optimized network operation.
What is VQML?
The simplest way to measure the quality of a video is to obtain the MOS (Mean Opinion Score) using human judgements. This is also the most accurate way, but it requires too many people and too much time and cannot be proceeded in real-time.
In order to resolve these time and cost problems, VQML takes high volume of video data and continuously trains a neural network to predict the video quality score as accurately as the human judgements.
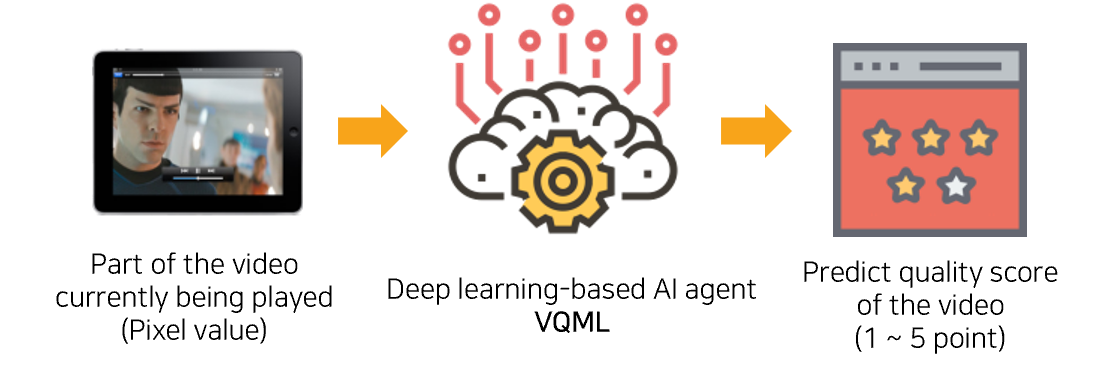
Using deep learning, VQML learns patterns of videos and MOS values from a database derived from viewers’ large-scale surveys.
VQML predicts the quality of the video as a MOS value within a range of 1 and 5 which corresponds to the actual human perception.
The meaning of each score is as follows.
Score | Quality Perception |
5 | Excellent |
4 | Good |
3 | Fair |
2 | Poor |
1 | Bad |
Figure 3. Video quality assessment in VQML
Techniques in VQML
Methods for Video Quality Assessment (VQA) include Full Reference (FR), Reduced Reference (RR), and No Reference (NR).
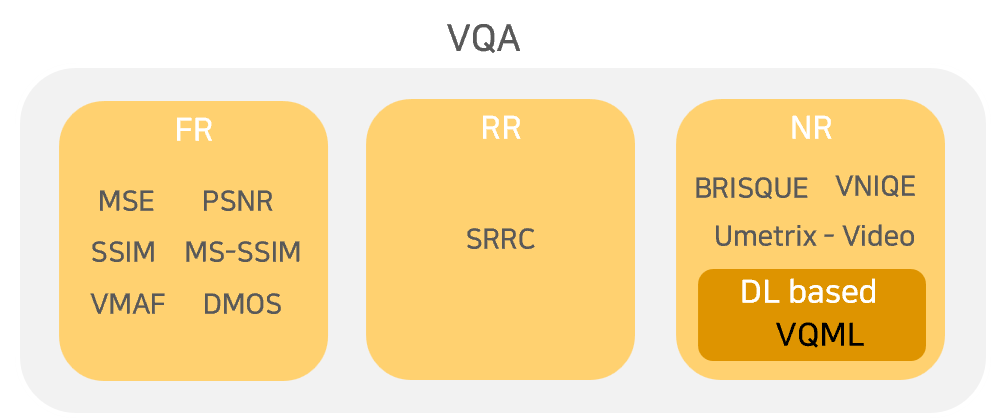
Figure 4. Video Quality Assessment Solutions
FR, which is currently used by most products, evaluates the quality by comparing the original video with the received video. Although it shows high reliability due to direct comparison between videos, it is difficult for the client to have the original video. It is also difficult to be used on platforms where videos are created and serviced in real-time.
For this reason, FR method is not a suitable solution due to its limitations especially in current situations where live-streaming services are commercialized, and video conferences and classes are increasing due to the Covid-19.
VQML operates based on the NR method that measures quality only with the received video. Without the need for the original video, NR method can calculate the quality metric of any video in real-time and effectively assess the video quality in areas where FR methods are difficult to apply.
Some well-known areas where NR methods are ideal quality assessment tools are CCTV and real-time video platforms. These areas can utilize the NR method to measure the actual perceived quality by identifying all the degradation factors on their own video without a comparison video.
NR method mostly measures quality by extracting statistical characteristics of the video with mathematical algorithms. It works based on the KPI designed by researchers, so it may result in large average error compared to the actual quality score perceived by humans.
VQML uses large-scale and highly reliable database to repeatedly train itself to continuously improve its prediction of video quality score in order to compensate for the limitations of the NR method.
Learning & Evaluation Process of VQML
The training of VQML uses the KoNViD-1k and YouTube-UGC datasets. The KoNViD-1k dataset is a large database consisting of MOS collected from over 1,000 videos and dozens of viewers. The YouTube-UGC dataset refers to a video database with 4K UHD characteristics.
VQML’s deep learning network consists of 2 CNN modules and 1 GRU module.
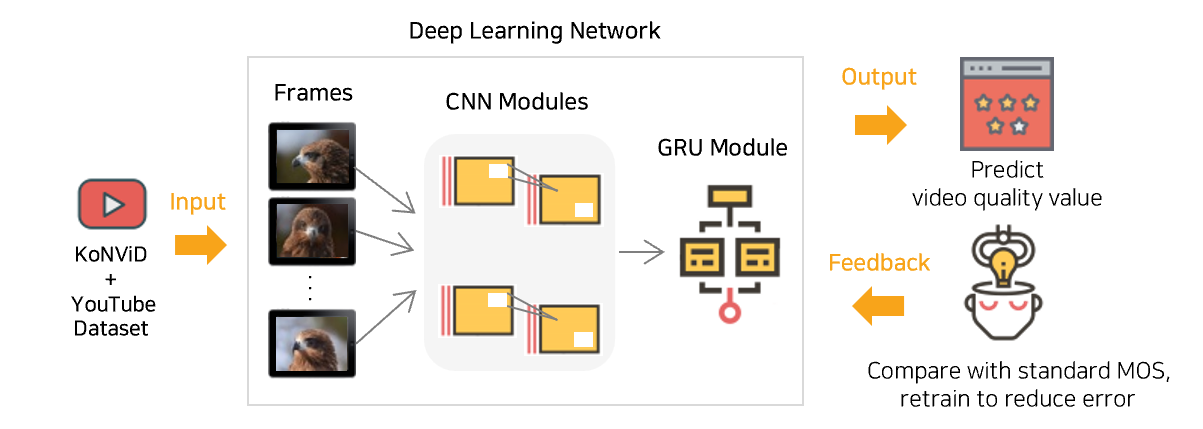
Figure 5. Learning Process of VQML
When a video sample from the learning dataset is input into the model, the CNN module processes each frame and the GRU module follows to analyze the sequence of consecutive frames in order to recognize the pattern of the features of the video sample. The extracted features are used to finally predict the quality of the video.
After the measurement result comes out, calculate the difference from the actual MOS and modify the deep learning network to reduce this error. By repeating this process, the deep learning network learns to measure the quality value of that video with minimal error.
After enough training, VQML can predict a video quality score that is very close to the actual MOS value.
Input & Output Value
VQML only requires the video itself to predict the video quality score. When the video is input into the VQML neural network, VQML automatically decodes it and converts it into frames, which are sets of pixel values expressed in RGB, and extracts features from the frames to compute the quality score of the video as the output of the model. VQML can execute this process in speed that is close to real-time.
By default, the quality score of the video is output after the entire video is processed through VQML. There is an option provided to adjust the video viewing time in order to predict the quality score for specific segments within the video.
Dataset Utilized in VQML
Deep learning method has recently been applied to various applications. A highly acknowledged database is required to ensure reliable performance of such deep learning-based solutions.
The KoNViD-1k database (http://database.mmsp-kn.de/konvid-1k-database.html) used for VQML’s learning is a highly reliable database consisting of 1,200 videos evaluated by more than 100 people. It has been cited more than 130 times in papers around the world since the VQA group at the University of Konstanz, Germany, published it at the IEEE QoMEX 2017 academic conference, and is widely accepted by academia as a database for video quality assessment.
Another learning database, the YouTube-UGC dataset, contains user-generated content collected from YouTube, providing videos of different resolutions and formats. Some of them have 4K UHD (Ultra High Definition) characteristics, which are useful resources for research and development activities and are widely sed for quality evaluation and content classification.
The KoNViD-150k database (http://database.mmsp-kn.de/konvid-150k-vqa-database.html), released in 2021, also consist of KoNViD-150k-A set (152,265 videos evaluated by 5 people) and KoNViD-150k-B set
(1,577 videos evaluated by more than 89 people), ensuring high reliability. The VQA group at the University of Konstanz says this database can be used for efficient video quality tests. Besides the training datasets from KoNViD-1k, VQML utilizes the KoNViD-150k-B set database for objective performance testing.
This allows the deep learning network in VQML to have high accuracy and perform video quality prediction that reflect patterns in real-world communication environment.
Outstanding Points of VQML
VQML is also unique in the configuration of deep learning networks.
VQA solutions based on deep learning often include transfer learning using pre-trained CNN modules.
Most solutions utilize a pretrained CNN module followed by a recurrent module such as a LSTM or GRU module. In such structure, the CNN module is pre-trained using the Image Net database (https://www.image-net.org/download.php) consisting of more than 1 million images built by Professor Li-Fei-Fei at Stanford University. The model’s learning process based on the training database only occurs throughout the following recurrent module.
In contrast, VQML consists of 2 CNN modules and
1 GRU module. Each CNN module is pre-trained with the ImageNet database and the KonIQ-10k database (http://database.mmsp-kn.de/koniq-10k-database.html) which is a set of over 10,000 images produced by the VQA group of the Konstanz University. Then a GRU module continues to train the model with the features extracted from the 2 previous CNN modules. So the actual learning based on the training data occurs through all 3 modules. In order to mimic a unique characteristic of the human visual system, a temporal pooling layer is added. This layer takes into account how humans perceive an instant degradation in video quality due to a sudden drop in the streamed video much greater than it actually is, and result in a stronger degradation in overall video quality.
In conclusion, VQML is able to extract highly detailed contextual as well as temporal characteristics of the assessed videos better than the other VQA solutions.
High Performance of VQML
Figure 9 is a verification graph of VQML’s performance based on the KoNViD-1k dataset.
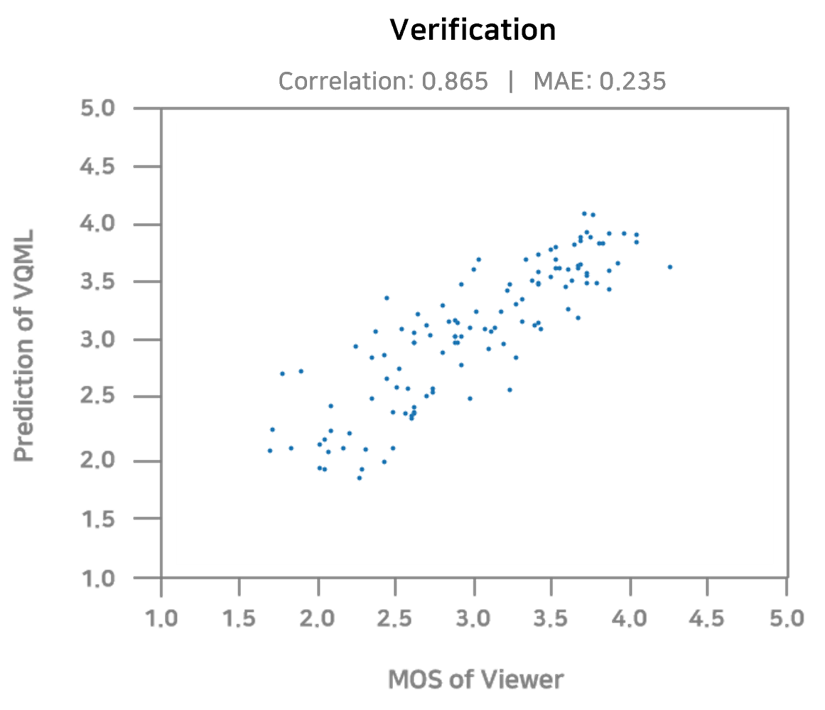
Figure 9. Correlation with Ref-MOS and VQML
This is the correlation between the actual viewers’ MOS and the quality score predicted by VQML.
The measurement results are very close to the actual MOS values forming almost a straight line.
The graph shows a correlation of about 86.5%, which proves the VQML is a reliable solution.
Also, the MAE (Mean Absolute Error) of VQML is 0.235, which is smaller than the average MAE of other products currently commercially available. This means that the output of VQML’s prediction can be as accurate as the human perception on judging the quality of the Video.
Verify Reliability of VQML
To verify the reliability of VQML, tests were conducted using various types of videos. Each video has its own characteristics that represent the video quality in a specific environment.
Type | Feature |
Drama | General screen |
Movie | Relatively dark screen |
Sports | Lots of movement and bright light |
Animation | Artificial color that stands out |
Figure 10. Video types and features used in tests
After distorting the indicators of each video into several units using the FFmpeg codec, the MOS value of the video to which the distorted indicators were applied was measured.
| Blockiness | |
| Option | Change the degree of block generation by adjusting the bitrate with b:v option |
| Unit | 10000k / 5000k / 1000k / 500k / 300k/ 200k / 100k |

| Blur | |
| Option | Use the boxblur option to adjust the degree of blur in the video |
| Unit | 0.0 / 2.5 / 5.0 / 7.5 / 10.0 / 20.0 / 30.0 |

| Brightness | |
| Option | Change brightness by adjusting brightness option of Eq AVOptions |
| Unit | -1.0 / -0.75 / -0.5 / -0.25 / 0 / 0.25 / 0.5 / 0.75 / 1.0 |

| Colorfulness | |
| Option | Color distortion by adjusting the saturation option of Eq AVOptions |
| Unit | 0.0 / 0.5 / 1.0 / 1.5 / 2.0 / 2.5 / 3.0 |

| Resolution | |
| Option | Change the resolution with the scale option |
| Unit | 2160p / 1440p / 1080p / 720p / 480p / 360p / 240p / 144p |

Figure 11. Encoding options, units and examples applied to video indicators
The measurements made using the VQML algorithm are as follows.
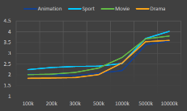
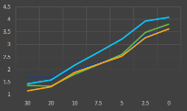
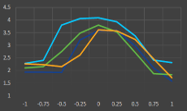
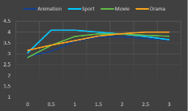
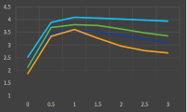
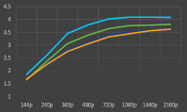
Figure 12. MOS value measurement results for distorted indicator-specific video
| Colorfulness | |
| Option | Color distortion by adjusting the saturation option of Eq AVOptions |
| Unit | 0.0 / 0.5 / 1.0 / 1.5 / 2.0 / 2.5 / 3.0 |

| Contrast | |
| Option | Change the contrast by adjusting the contrast option of Eq AVOptions |
| Unit | 0.0 / 0.5 / 1.0 / 1.5 / 2.0 / 2.5 / 3.0 |

| Contrast | |
| Option | Change the resolution with the scale option |
| Unit | 2160p / 1440p / 1080p / 720p / 480p / 360p / 240p / 144p |

Figure 11. Encoding options, units and examples applied to video indicators
The measurements made using the VQML algorithm are as follows.
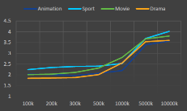
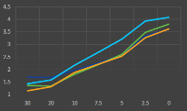
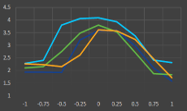
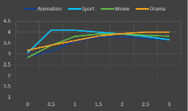
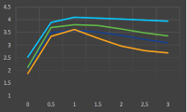
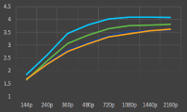
Figure 12. MOS value measurement results for distorted indicator-specific video
When the MOS value according to the change of each encoding option was compared with the original video, the original recorded the highest score. In other words, as the degree of distortion increases, the video quality decreases, and the MOS value measured by VQML tends to decrease.
These results are interpreted as important indicators showing that VQML is a reliable tool for video quality evaluation.
As such, VQML, an original video quality assessment solution unique to Innowireless, is expected to be sufficiently competitive in the market.